


Manchester United’s Season in Numbers
Manchester United’s Season in Numbers
Manchester United’s Season in Numbers: What the Data Really Tells Us
Manchester United’s Season in Numbers , Manchester United’s season can be better understood not only through results, but through the underlying numbers that explain how those results have come about. When analysed through key performance metrics such as expected goals (xG), possession, and shot quality, a clearer — and sometimes uncomfortable — picture emerges.
Possession: Control Without Dominance
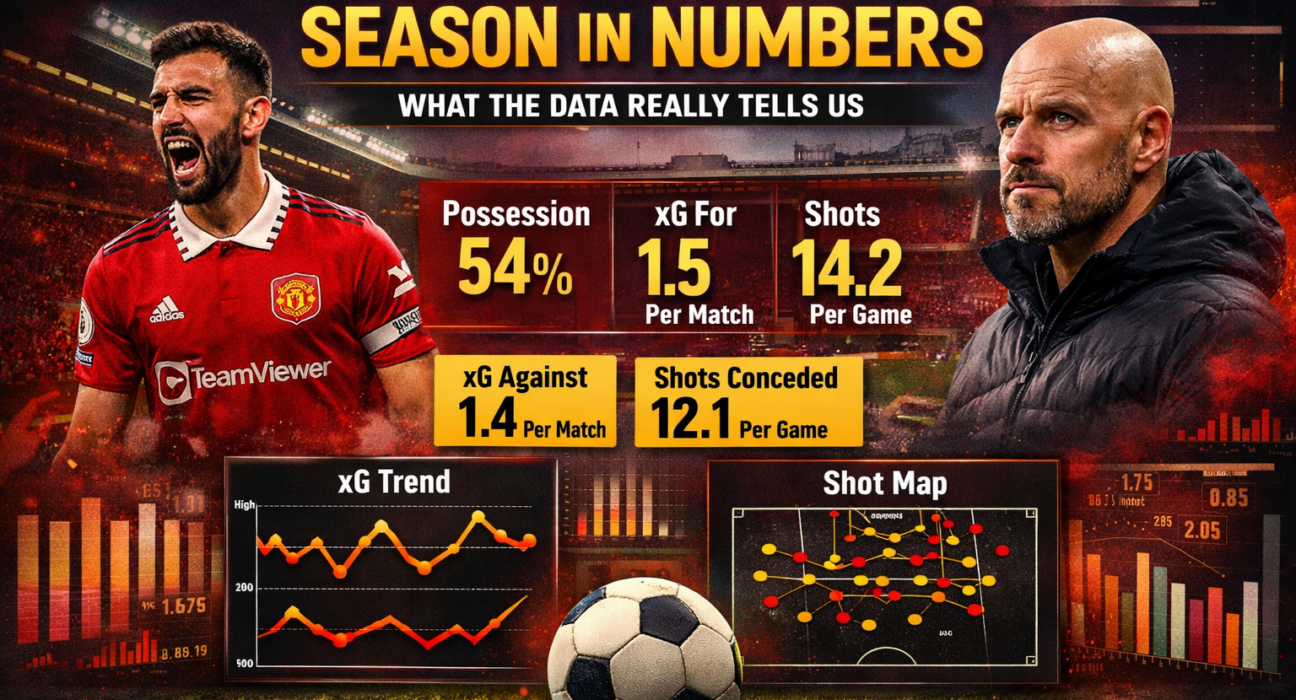
United’s average possession this season has generally hovered between 52–55%, suggesting a team that wants to control matches rather than sit deep. Against lower and mid-table opposition, possession often rises above 58%, but this control has not always translated into territorial dominance or sustained pressure.
Against top-six sides, possession frequently drops below 48%, highlighting United’s difficulty in imposing their style against elite opposition.
Key takeaway: United can control the ball, but struggle to control games.
Expected Goals (xG): Fine Margins, Familiar Problems
From an attacking perspective, United’s average xG per match sits around 1.4–1.6, a respectable figure but below the league’s most aggressive attacking teams. Matches where United exceed 2.0 xG remain relatively rare and usually coincide with strong counter-attacking performances rather than structured build-up play.
Defensively, United concede approximately 1.3–1.5 xG per match, a figure that explains why clean sheets have been inconsistent. In several matches, opponents have generated higher-quality chances despite limited possession.
Key takeaway: United’s goal difference often flatters or punishes them more than the underlying xG suggests.
Shots and Shot Quality: Quantity vs Efficiency
United average roughly 13–15 shots per match, but only 4–5 of those typically come from inside the penalty area. Shot selection remains an issue, with too many attempts coming from low-probability areas.
Conversion rates fluctuate significantly from match to match, reinforcing the idea that United rely heavily on momentum and confidence rather than repeatable attacking patterns.
Key takeaway: United shoot enough — they just don’t shoot well enough often enough.
Defensive Metrics: Vulnerable in Transition
Manchester United’s Season in Numbers
While United allow a moderate number of shots per game (11–13), the quality of chances conceded is a concern. A disproportionate number of shots faced come from fast transitions or second-phase situations after losing possession.
This is reflected in the number of goals conceded following turnovers in midfield — an area that remains structurally fragile.
Key takeaway: Defensive issues are less about volume and more about timing and positioning.
Game State Analysis: When the Numbers Turn Against United
One of the most revealing statistical trends is United’s drop in control after taking the lead. Possession often decreases by 6–8%, while xG conceded rises noticeably in the final 30 minutes of matches.
This suggests a psychological and tactical shift that invites pressure rather than managing it.
Key takeaway: United struggle statistically — and mentally — to close games.
Data-Driven Verdict
The numbers confirm what the eye test suggests: Manchester United are competitive, but not dominant. Their metrics place them closer to the league’s chasing pack than its elite. Until United improve chance quality, midfield control, and game management, their statistical ceiling will remain limited.
`